Analytics Stage in Software Development: How to Clarify Requirements

IT copywriter
Reading time:
In the past post, we shared our view on the essence and role of analytics. This time, you will learn about the tools that we use to solve analytics tasks, as well as their features and purpose. Read on to learn how to communicate with analysts effectively.
Analysts are an intermediary between business, design, and development. They shift in one direction or another while keeping the process of building a product reasonable. They help clients and developers understand one another and collect, clarify and prioritize requirements. This allows for more informed decision-making.
To make interactions between the client, analyst and developers more efficient, we use a specific set of artifacts. For each project, we select the exact set that is needed for a comprehensive description of the software. The types and content of documents depend on the desired outcomes, stakeholders and the team. We will introduce you to the main artifacts, what they are and why we use them.
Vision
This is the first artifact that appears in the project. It is a text document that briefly describes the main idea of the project. It defines the product that needs to be developed while taking into account the needs of stakeholders.
Vision defines:
- who wants what
- why they want it
- how things should be arranged so that everyone is pleased with the outcome
- what needs to be done to achieve the desired outcome
Vision contains the most essential requirements, limitations and acceptable levels of quality.
Vision is used to detail and decompose the requirements. Based on this artifact, a suitable set of artifacts for the project is determined and a solution for the project tasks is formed.
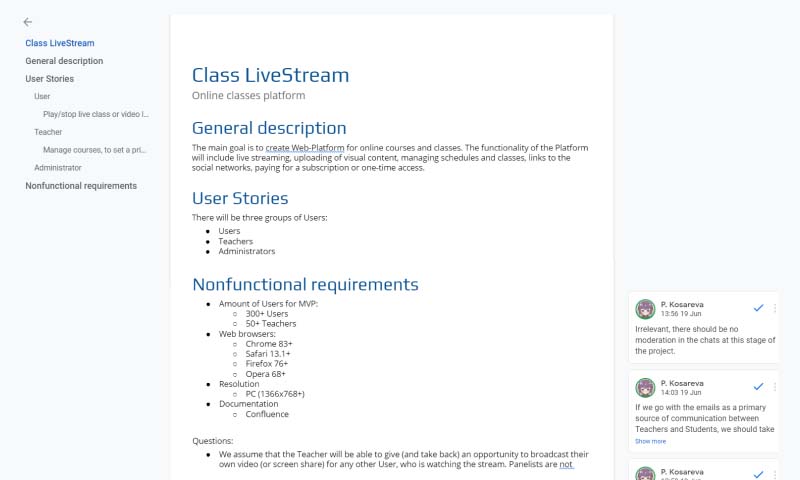
An example of Vision for an online learning platform development project
User Stories
These are short statements of intent describing something the system should do for the user. We usually prepare them together with the Vision.
Each text – User Story – should explain the role or actions of the user in the system, his needs and the benefit that the user will receive after the story happens.
For example: As a [person], I [want to], [such that].
- They do not describe the requirements in detail (that is, what the system should do), but rather represent the intent under discussion (the system should do something like this).
- They are relatively easy to estimate, making it easier to identify the effort required to implement.
- They don’t take up a lot of space when compared to large documents. Rather, they are organized into lists that can be reorganized and reordered as new information arrives.
Further analysis is carried out based on User Stories.
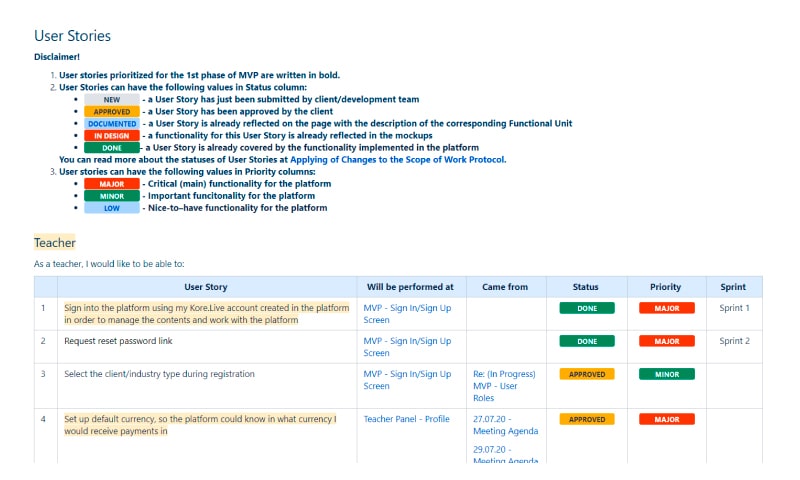
An example of User Stories for an online learning platform development project
Use Cases
Like User Stories, they describe how a user should interact with the system to achieve a specific goal. So what’s the difference between use cases and user stories? User Stories help define the task and intent. Use Cases do not contain tasks and intents. Instead, they record functionality in more detail.
Let’s look at these differences using the hypothetical design of a conventional calculator.
The wording of the User Story could be: “As a user, I want to be able to perform mathematical operations to simplify mechanical calculations”.
The cases corresponding to this User Story can be as follows:
- Enter number
- Add number
- Subtract the number
- Divide by number
- Multiply by number
- Summarize
- Add the result to memory
- Clear memory
- Show number in memory
- Reset all
- Disable device
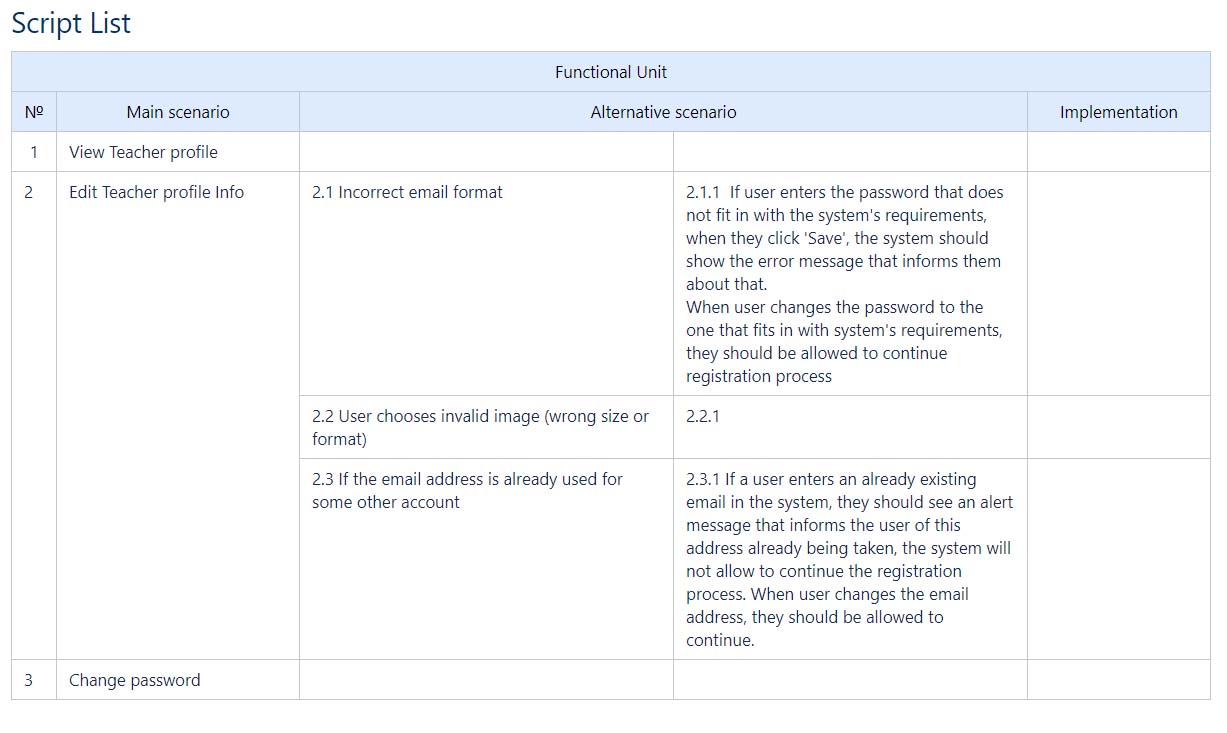
An example of Use Cases for an online learning platform development project
Tools for a visual description of processes, algorithms and relationships between entities
When the high-level description is ready, analysts progress to a more detailed description of the system. Here, the choice of tools is also based on the specifics of a particular project. Imagine that you’re developing a complex system. The project includes many documents, a part of the system that is embedded in a larger one, or many integrations. In this case, you may face functional limitations on what you can do in the allotted time. For example, the API that an external system provides imposes limitations on the implementation of the user registration functionality. These can be certain fields, parameters or conditions that must be included in the request. Sometimes technical limitations are imposed on the user interface as well. To understand the existing limitations and design convenient functionality, you need to figure out possible integration scenarios and choose the best ones. To do that, it is necessary to draw a diagram of components or deployments.
Now, let’s take a closer look at these tools. Recall that, for each project, we define the specific set of artifacts and their content.
Description of entities
Before development, we must formulate the concepts of objects, facts and events that the system will operate on. This requires bringing these concepts to one data model or another. In other words, we must replace them with information representations. You can see how we use the description of entities below.
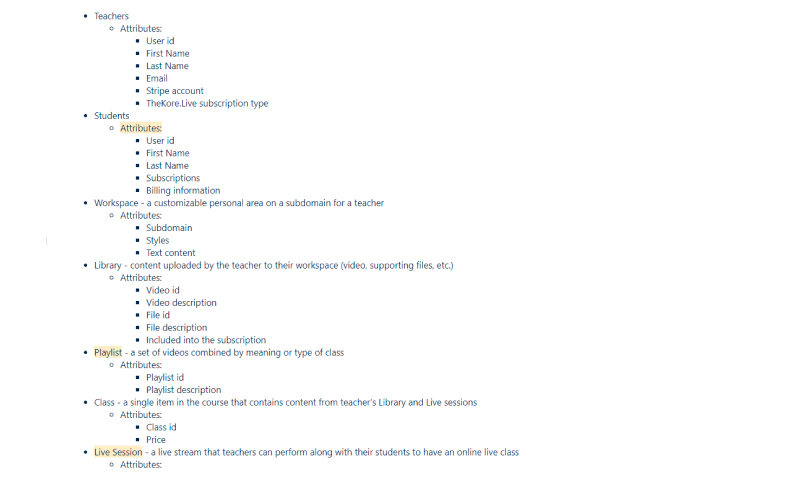
A list of Entities for an online learning platform development project
Component diagrams
The tools we have discussed above reflect the conceptual and logical aspects of building a system model. The logical representation includes concepts that have no material embodiment. In other words, elements of a logical representation that do not physically exist. These include things such as classes, associations, states, and messages.. With their help, we can understand the static structure as well as the dynamic aspects of the system’s behavior.
To create a physical system, all the elements of the logical representation must be implemented as material entities. To describe such entities, we use a physical representation of the model, including a component diagram.
Thus, a component diagram helps:
- visualize the general structure of the system source code
- reuse separate pieces of program code
- present a conceptual and physical schema of databases
System analysts and architects as well as programmers are involved in the development of component diagrams.
Deployment diagram
The diagram shows the system infrastructure graphically. It shows where the network devices are located and how they are connected. Using the diagram, we determine computers’ processing information, how they are related to each other and what additional resources (printers, modems, routers, etc.) should be used.
Elements of a deployment diagram are nodes, components, and the relationships between them. A node is some physically existing element of a system. Computers, sensors, printers, modems, digital cameras, scanners, and many others can be considered nodes.
The deployment diagram helps distribute system components across the network nodes, which affects system performance. The diagram helps solve many auxiliary tasks related (e.g. ensuring security).
Screen map
A screen map is a diagram showing individual screens, their location (hierarchy) and interrelationships. It helps to preserve the integrity of the interface, structures the work and makes it more transparent and predictable.
Additionally, a screen map helps in developing a navigation system for the application. If you plan new elements of the system in the future then, based on the screen map, you can determine where and how to add them.
When there are no interactive prototypes, a screen map allows you to demonstrate the logic of a business process.
Block diagrams
We usually use block diagrams to describe processes. They are useful when you need to:
- understand which elements of the system are involved in the process
- determine what tasks need to be done to create such a process
- develop modifications to an existing process
- investigate where problems may arise
You can also show a map of screens or any other diagram using a block diagram – for example, Use Cases. Basically, a block diagram is a flowchart with a unique legend. It helps to visually represent the system from a certain point of view.
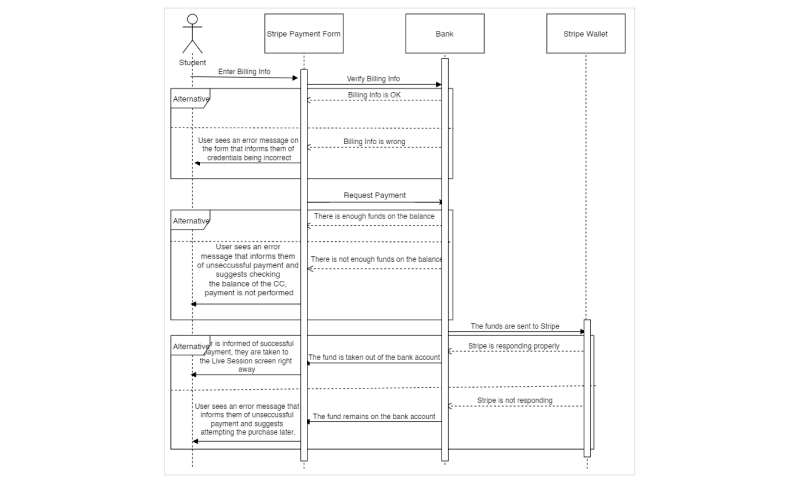
Block diagram of the payment process for an online learning platform development project
Wireframes
A wireframe is a low-fidelity way of showing a design. It’s the graphic representation of an app or a website containing the most essential elements and content. It also describes how users interact with the interface.
Prototypes
Often confused with a wireframe, a prototype is a medium or a highly detailed representation of the final product. It simulates user interaction with the interface and allows users to rate the content and interface and test the primary options for communication with the app.
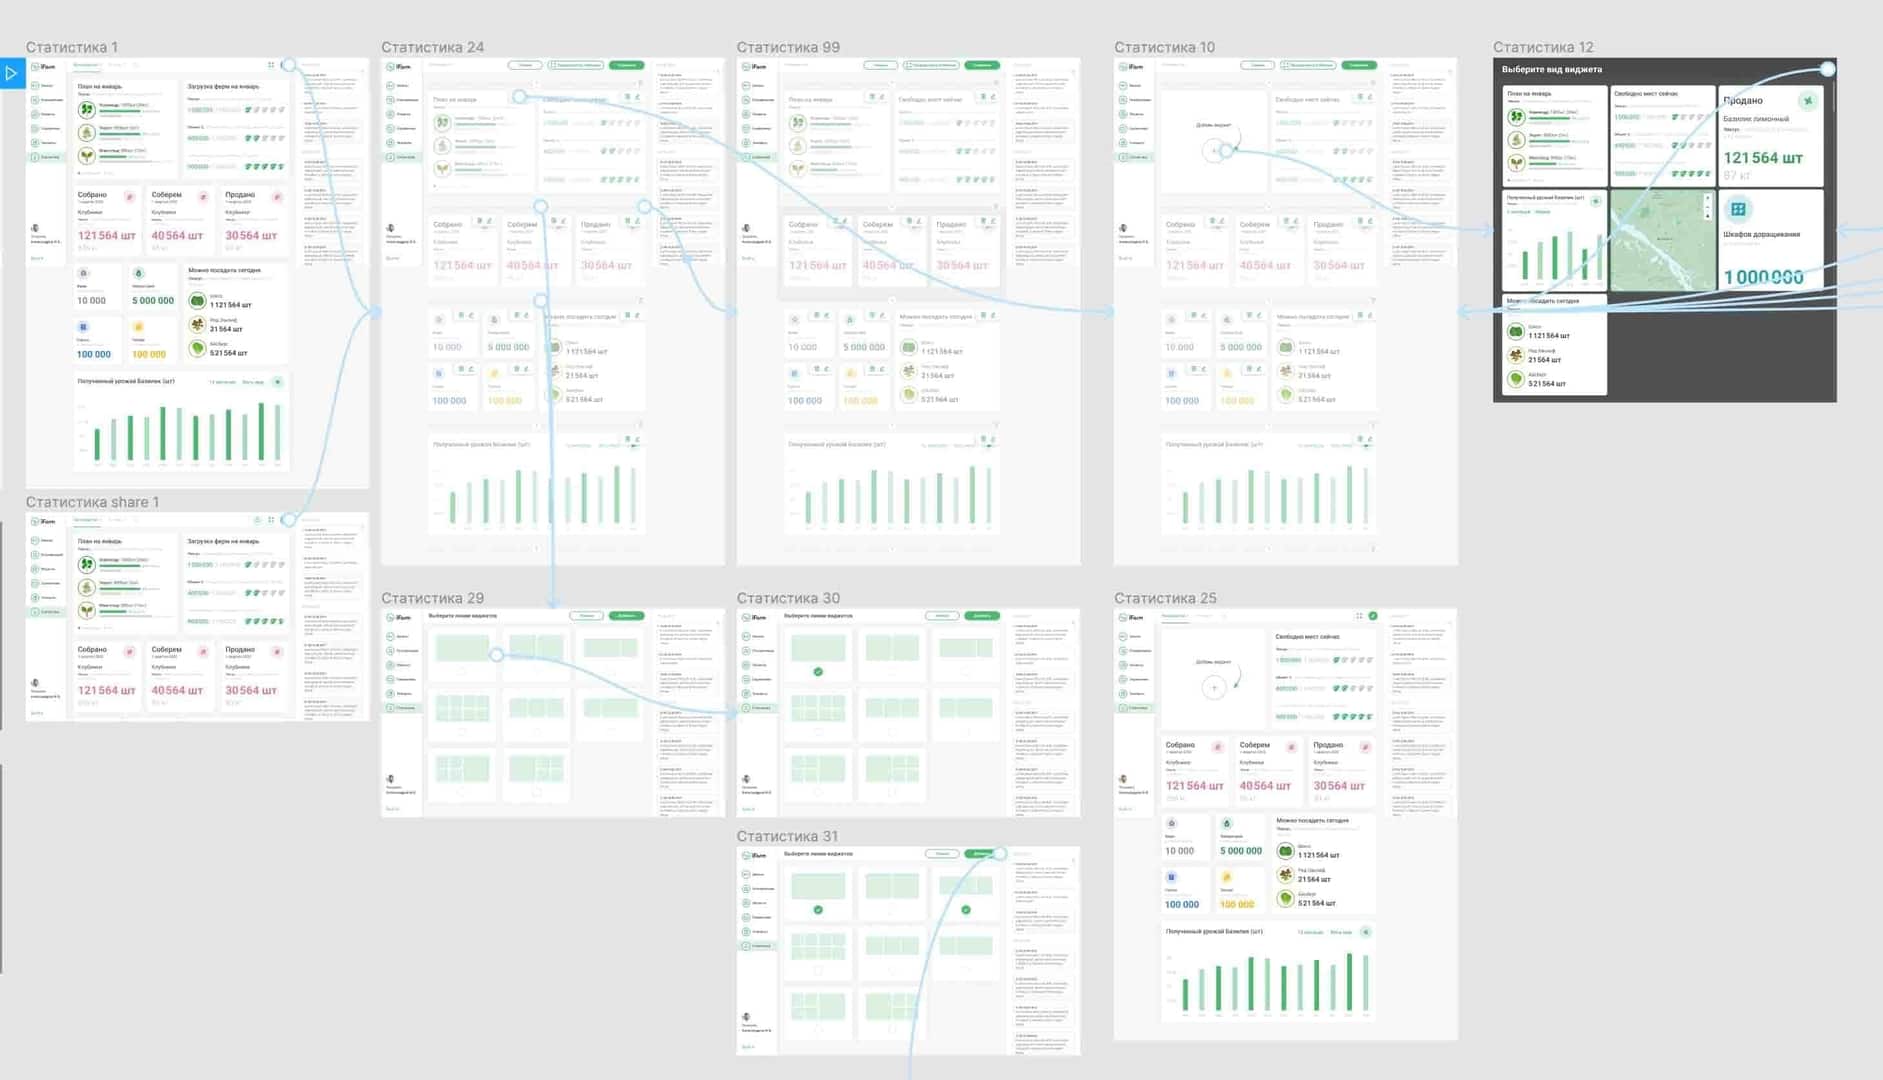
Prototypes of the Monitoring module for iFarm project
Design
We prepare a design based on wireframes and prototypes. The design includes working on the corporate identity – choosing a palette of colors, fonts, stylistic design as well as patterns and decorative elements. Also, based on design layouts or prototypes, we make a description of the elements and implementation features. We describe non-obvious things such as hovers, animation, click actions and non-standard navigation.
As a result, the design layouts are approved by the client. Then, the approved layouts are transferred to development.
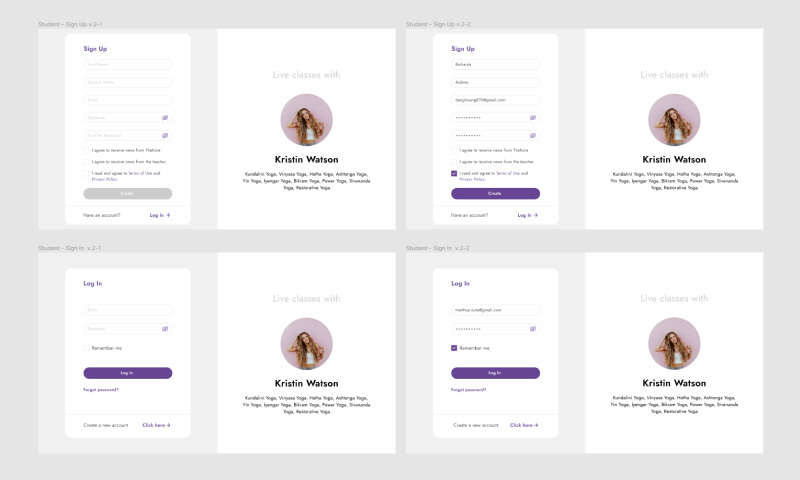
Login screen design for an online learning platform development project
User instructions
We write instructions to help users understand the program’s main functions and how it works.
This helps at the stage where the product is introduced into business processes. A well-written set of instructions greatly simplifies the training of personnel on the new functionality.
Conclusion
The described set of artifacts and interactions helps the analyst facilitate the exchange of information between business and development and makes communication highly effective. And this is one of the main components of the success of the entire project as a whole.
We wish you only the best user interfaces! If you are interested in working with Azoft, please contact info@azoft.com.


Comments