One of our regular US clients asked us to develop a web application with an interactive map.
The Solution
We organized the work on the project in the form of weekly sprints. At the end of the sprints, a version for testing was rolled out to the customer.
The system consists of the following components:
- a parser in Node.JS that parses data from 1000+ files daily
- backend and admin panel in PHP (Laravel)
- frontend on React
The main functionality of the application allows users to:
- see the water temperature and the bottom topography on the selected route
- identify the directions of winds and currents
- navigate the weather 3 days ahead
- find out if there are fish on the route (there are 34 species in the database)
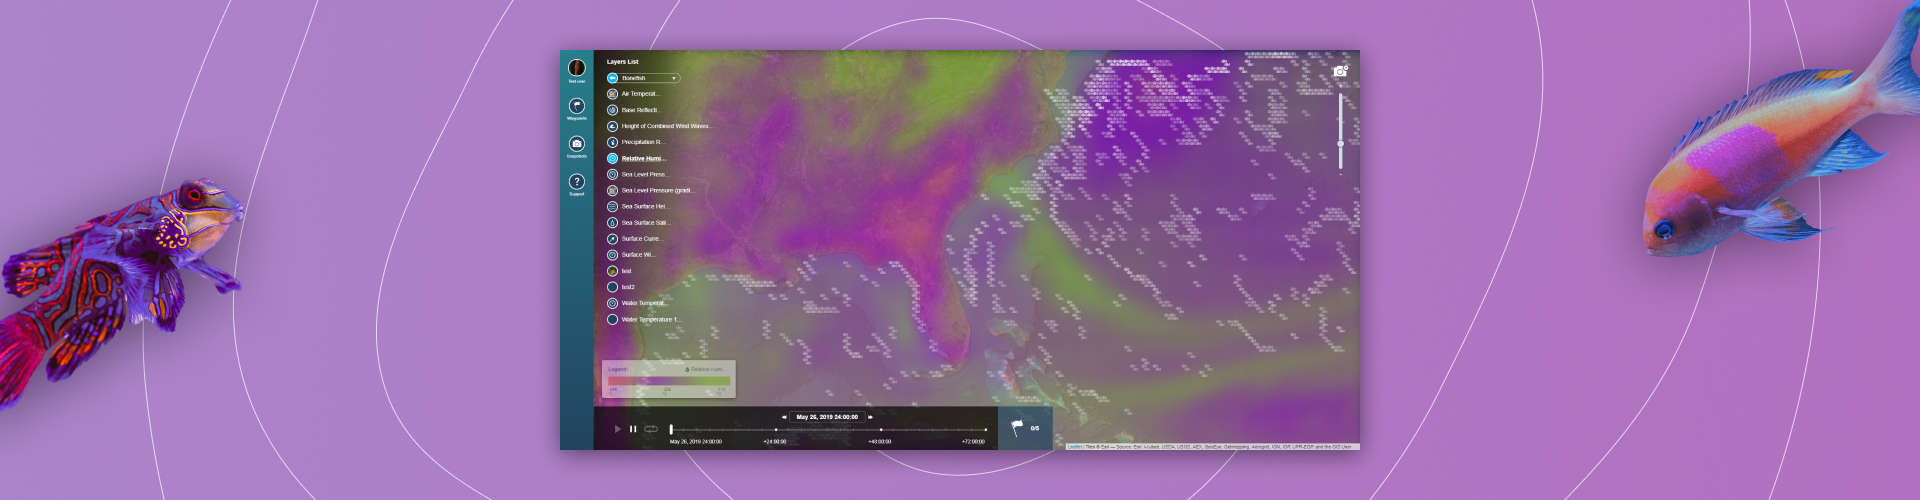
The application also shows the sea surface’s salinity, reflectivity, and many other parameters. To see this information users turn on the appropriate layers in the “Layers List”. The parameters have different visual presentations. For example, atmospheric pressure is shown as an outline, and the directions of currents are shown using vector animation.
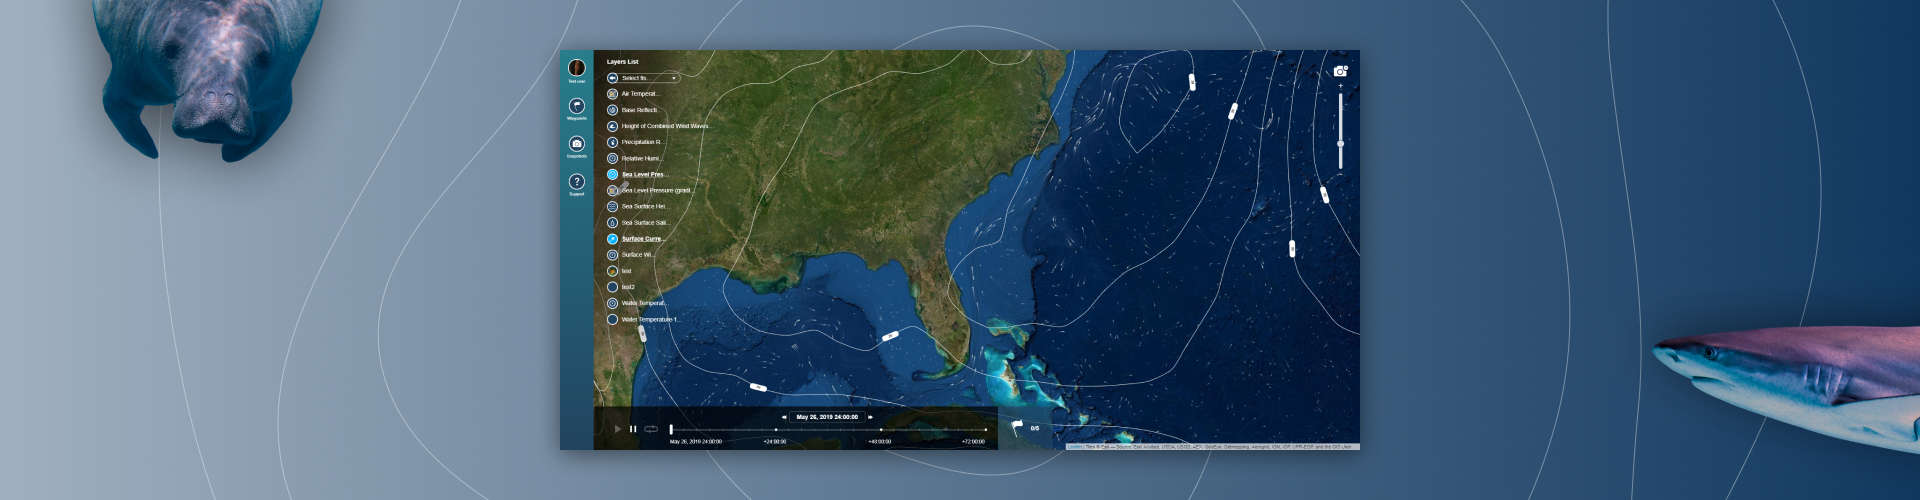
Relative humidity, seawater salinity and water temperature are displayed as a gradient, and the presence of fish is displayed graphically.
Using the application, users can build routes and view data on the set waypoints in the “Waypoints” section of the menu.
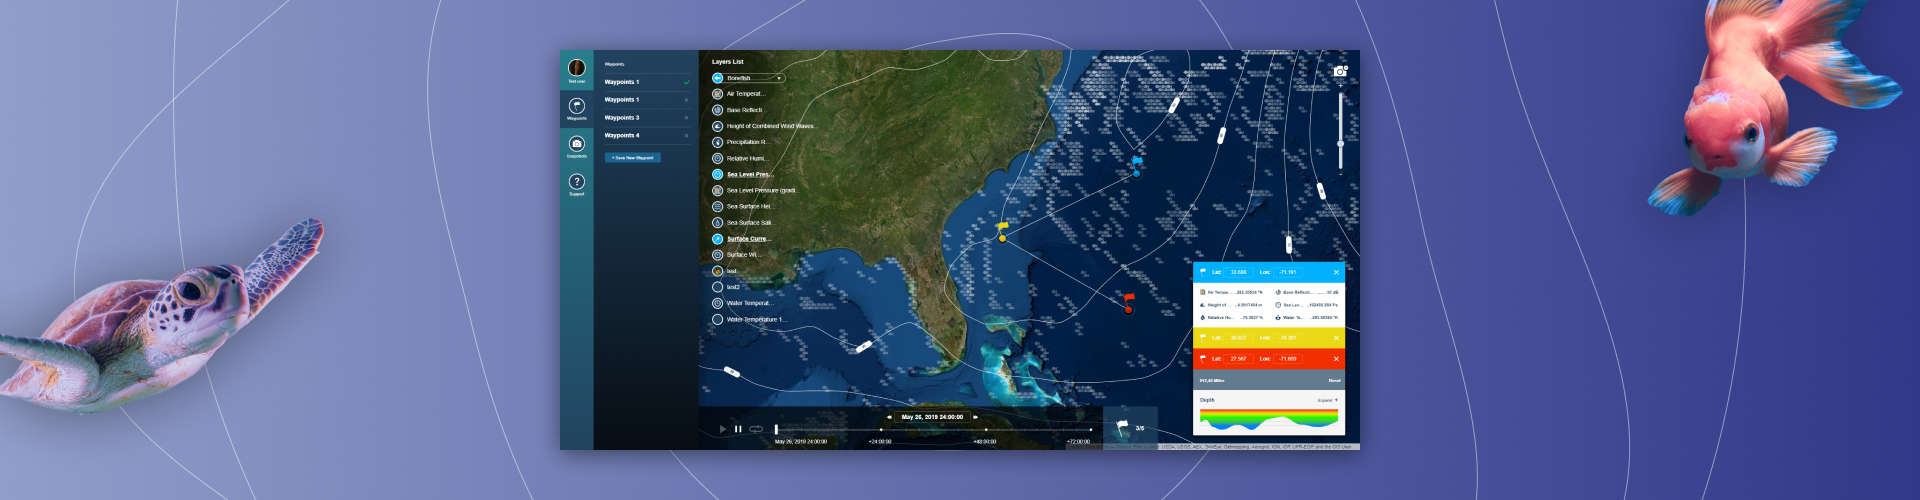
To quickly save the map with the current settings, you need to click the button in the upper right corner. The created snapshots are stored in the Snapshots section, from which they can be downloaded.
The project required processing and visualizing complex computational data. To do this, we used mathematical algorithms. For example, the temperature was drawn using linear and bicubic interpolation, and the method of marching squares was used for isolines.
In addition, we needed to store and process arrays of text data in 10 GB, scattered over several hundred files. To simplify the display of data and reduce the load on the user’s device, we saved three variants of the data (according to the map zoom levels) in the form of a matrix for each of the 70 data layers.
Next, we had to choose between storing values by points or just as a matrix of values. The second option turned out to be significantly faster. All values were eventually stored in the database in a JSON field. Thanks to this, we were able to quickly obtain the value of a specific layer at a specific point. The initial result was one layer per hour, and we reduced the time to 20 minutes on the test server. At the client’s staging on Amazon, it was possible to achieve the result in a few minutes!
The Result
We met the tight deadlines and our client was satisfied with the result. The application helps you monitor data about the ocean: water temperature, depth, currents and wind directions, the presence of fish and other indicators. Fishing companies can now receive the up-to-date information they need to plan their routes with just a few clicks.
Stack
React, Laravel, PostgreSQL, Redis, Node.js
Stack
-
 Redis
Redis -
 PostgreSQL
 -
 NodeJS
Related projects
-

Azoft WebChat
Learn more